Why Market Timing Myths Are So Persistent
Housing decisions carry enormous financial and emotional weight, which makes people especially vulnerable to oversimplified rules. Myths about home prices spread easily because they contain a kernel of plausible logic — prices do rise, corrections do happen, and timing does matter at the margins. The problem is that these half-truths get hardened into absolute rules that ignore local conditions, individual financial circumstances, and the real mathematics of homeownership.
Understanding what the data actually shows — and where it falls short — is the first step toward making decisions based on evidence rather than anxiety. The myth-and-fact pairs below address the most consequential misconceptions we see repeated across the home buying process.
Myth
It's always a bad time to buy — prices are too high and you should wait for a crash.
Fact
Timing the market is extremely difficult, and prolonged waiting often increases total housing costs rather than reducing them.
This belief leads many potential buyers to remain renters indefinitely, assuming a dramatic price drop is always around the corner. In reality, while home prices do cycle through corrections, waiting for a significant crash means forgoing equity accumulation and locking in years of rent payments with no ownership stake. Even during notable downturns, prices in many metros declined modestly before recovering. For buyers with stable finances and a long time horizon, the cost of waiting frequently exceeds any savings from a slightly lower purchase price. See our guide to housing market cycles for a deeper look at how corrections actually unfold.
Myth
Home prices always bounce back quickly after they fall.
Fact
Recovery timelines vary widely by region, economic conditions, and the severity of the original decline — some markets took a decade or longer to recover after the 2008 housing crisis.
The assumption that real estate is always a short-term safety net can mislead buyers who purchase expecting rapid appreciation. After the 2008 financial crisis, many markets in the Midwest and parts of the South took well over five years to return to pre-crisis price levels, and some never fully recovered in inflation-adjusted terms. Recovery speed depends heavily on local employment trends, population growth, and available housing inventory. Buyers should plan for a realistic ownership horizon — generally a minimum of five to seven years — before assuming they can sell at a gain.
Myth
A lower home price automatically means a better deal.
Fact
The true cost of a home purchase is driven by both the purchase price and the prevailing mortgage interest rate — a lower price at a higher rate can result in greater total interest paid.
Many buyers focus exclusively on the listing price while underweighting the impact of mortgage rates on their total payment. A $400,000 home financed at 7% carries a meaningfully higher monthly payment and total interest burden than the same home priced at $450,000 financed at 4%. This does not mean buyers should ignore price, but it does mean that the combination of price and rate — not price alone — determines affordability. Common down payment misconceptions often compound this error by creating unrealistic expectations about upfront costs as well.
Myth
National housing market news tells you what you need to know about your local market.
Fact
Real estate is hyperlocal, and national averages routinely mask opposing trends in individual cities, neighborhoods, and ZIP codes.
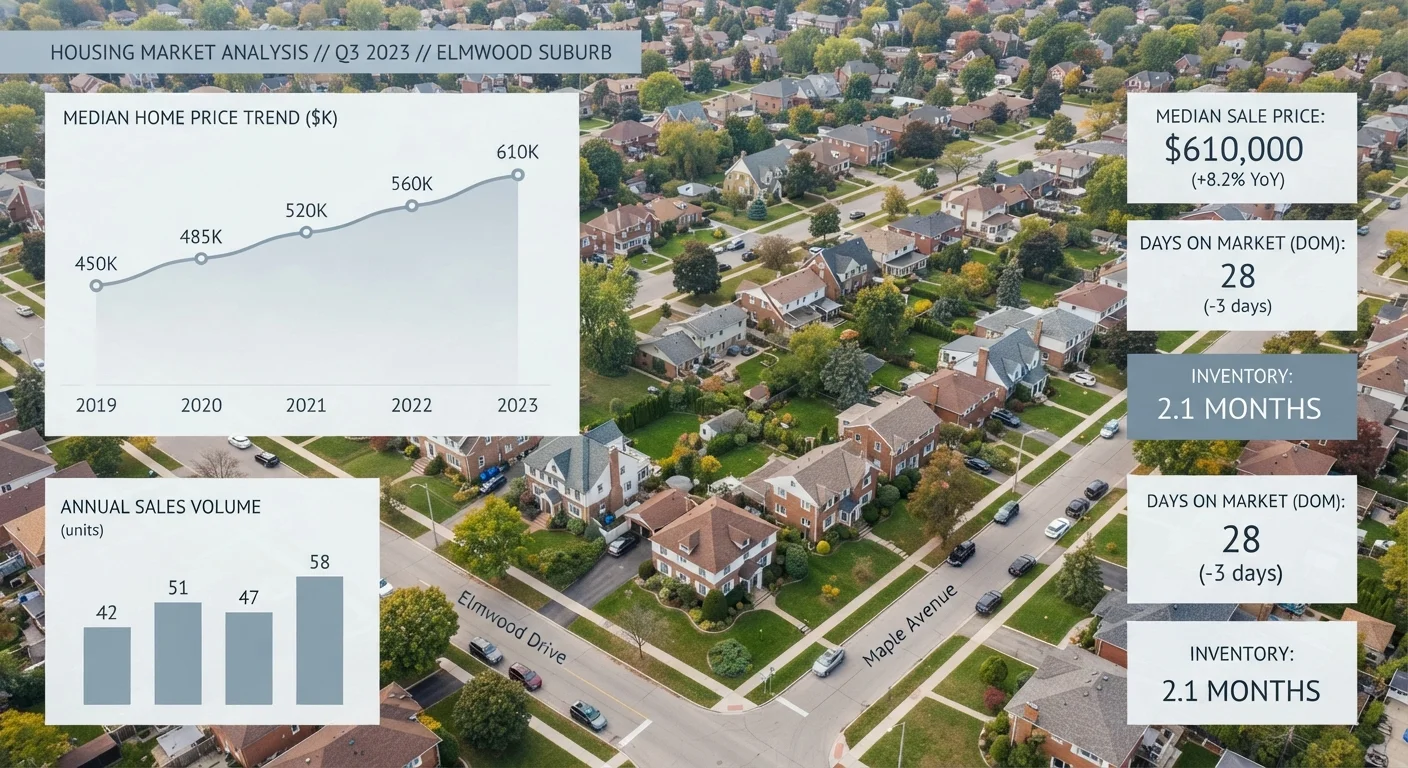
A headline reporting that median home prices fell nationally may actually reflect declines concentrated in a handful of high-priced coastal markets, while mid-sized inland metros continue to see price growth. Relying on national data to time a purchase or sale in your specific market is a common and costly mistake. First-time market watchers are especially susceptible to this error. The most reliable signals are local: days on market, months of supply, and the ratio of list price to final sale price in your target neighborhood.
Myth
Renting is always 'throwing money away' compared to buying.
Fact
Renting can be the financially sound choice depending on how long you plan to stay, your local price-to-rent ratio, and the opportunity cost of a down payment.
The rent-versus-buy calculus depends on several variables that are specific to each person's situation. In markets where home prices are extremely high relative to rents — measured by the price-to-rent ratio — it can take many years for a buyer to break even after accounting for closing costs, property taxes, maintenance, and mortgage interest. For someone who may relocate within two or three years, renting often preserves financial flexibility. This is general educational context, not personalized financial advice — consulting a qualified financial professional is recommended before making this decision.
Reading Market Data Without Getting Misled
Even readers who look beyond headlines can misinterpret the data they find. Median sale prices, for instance, reflect the midpoint of all transactions in a period — they shift when the mix of homes sold changes, not just when individual home values change. A surge in luxury sales can push the median up even if entry-level prices are flat.
5–7 years
Minimum recommended ownership horizon to offset buying costs
Housing economists and consumer finance organizations broadly cite this range as the breakeven window for most buyers, accounting for closing costs and transaction fees.
~10 years
Recovery time for some markets post-2008
According to Federal Housing Finance Agency data, certain regional markets took close to a decade to reclaim pre-crisis price levels in nominal terms after the 2008 downturn.
30–50%
Variation in price trends between metros in the same year
National Association of Realtors metro-level data routinely shows price movement diverging dramatically between cities even during the same quarter, underscoring the limits of national averages.
Similarly, inventory figures that signal a buyer's market nationally may not apply to the specific neighborhood you are targeting. Common traps for first-time market watchers include over-indexing on these aggregate numbers and under-weighting local signals like absorption rate and price-per-square-foot trends in your target ZIP code.
Your Local Market Is Not the National Market
National housing data is an average of thousands of distinct local conditions. A market cooling in one metro can coincide with intense competition in another city just 100 miles away. Before making any buying or selling decision, always verify what comparable properties are doing in your specific ZIP code — not what a national index is showing. Decisions grounded in local data consistently outperform those driven by national headlines.
Renovation decisions often carry similar misreading risks. If you are planning improvements to boost resale value, the renovation myths that lead homeowners astray are worth reviewing before committing to a project. And if broader investment questions are shaping your housing calculus, investing myths that keep people on the sidelines addresses parallel misconceptions in that space.
Beware of Acting on Trend Headlines Alone
A single data point — a monthly price change, a national inventory figure — rarely tells the full story. Before acting on a market headline, cross-reference it with local comps, mortgage rate conditions, and your personal financial position. Our housing market checkup guide provides a structured way to evaluate what the data actually means for your situation.
This article is for general informational and educational purposes only and does not constitute personalized financial, legal, or real estate advice. Consult a licensed real estate professional or financial adviser before making housing or investment decisions.