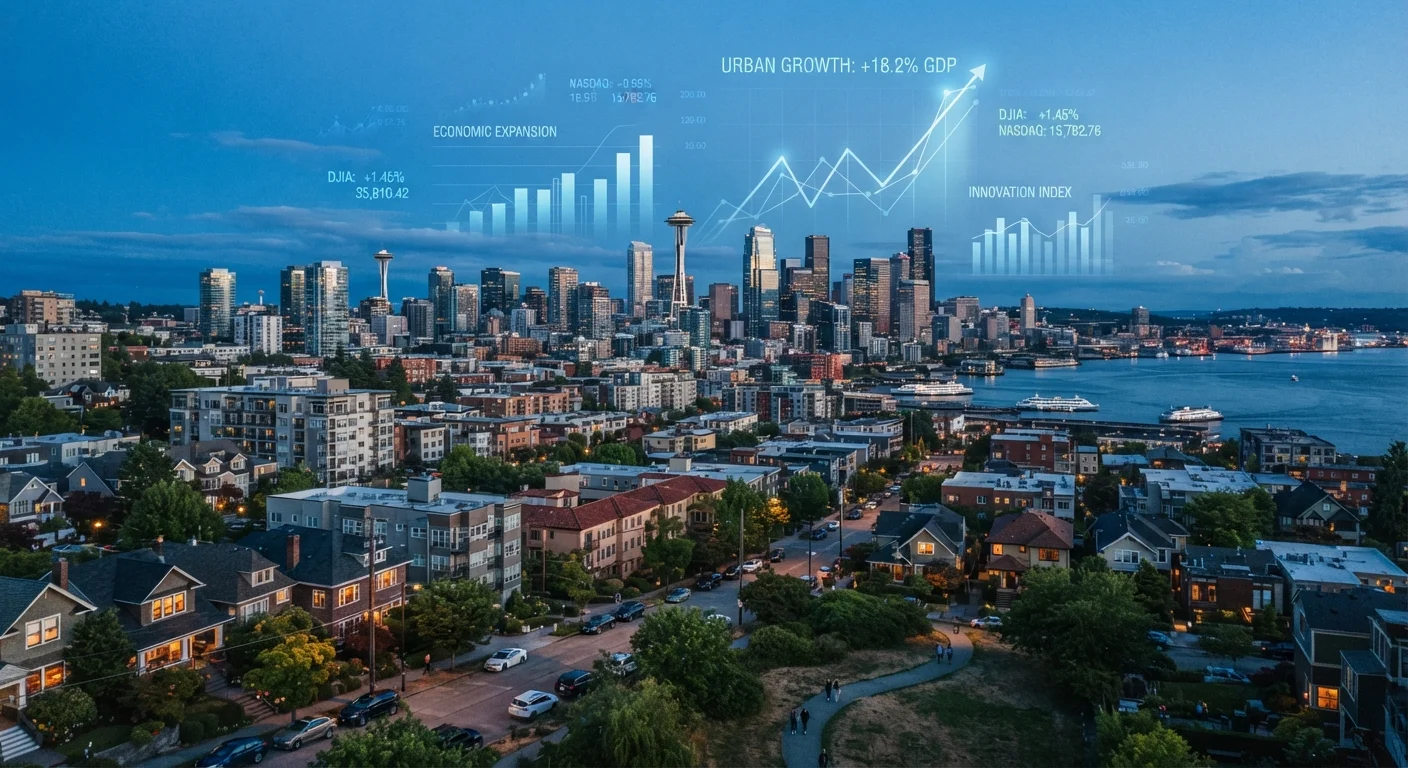
Why Economic Data Matters to Housing
Real estate headlines often focus on home prices, inventory levels, and days on market — but those figures are downstream of something bigger. The broader economy sets the stage for everything that happens in housing: who can afford to buy, how many homes get built, and whether sellers hold firm or cut prices. Understanding which economic signals tend to move the market can help buyers, sellers, and renters make more grounded decisions rather than reacting to noise.
These indicators don't operate in isolation. They interact with each other, and their effects vary by region. For a deeper look at how those forces play out over time, housing market cycles explained offers useful context. The signals below are among the most consistently influential — and worth tracking whether you're actively in the market or simply trying to stay informed.
Mortgage Interest Rates
Of all the economic signals that affect housing, mortgage interest rates have the most immediate and direct impact on affordability. When the 30-year fixed mortgage rate rises by even one percentage point, the monthly payment on a median-priced home can increase by hundreds of dollars. This compresses the pool of qualified buyers almost instantly.
Mortgage rates are closely tied to the yield on 10-year U.S. Treasury bonds, which themselves respond to Federal Reserve policy, inflation expectations, and broader investor sentiment. The Fed does not set mortgage rates directly, but its decisions on the federal funds rate ripple through credit markets and influence where rates land. Tracking Fed announcements and Treasury yields gives a reasonable early-warning signal for where mortgage rates may be heading.
A single percentage point rise in mortgage rates can add hundreds of dollars to a monthly payment.
Employment Levels and Job Growth
Housing demand is fundamentally tied to people's ability to earn a stable income. When employment is strong and job growth is broad-based, more households have the financial footing to buy or rent. When layoffs rise or hiring stalls, demand softens — particularly in markets where one or two large employers dominate.
The monthly jobs report from the U.S. Bureau of Labor Statistics, which includes total nonfarm payrolls and the unemployment rate, is one of the most widely watched economic releases in the country. Housing analysts pay close attention to both the headline number and underlying trends: which sectors are growing, whether wage growth is keeping pace, and whether full-time employment is rising. Job growth in a specific metro area often foreshadows local housing demand months before price data reflects it.
Job growth in a specific metro often foreshadows local housing demand well before price data catches up.
Inflation and Consumer Price Trends
Inflation influences housing from multiple directions at once. On one hand, it raises the cost of building materials and labor, which increases new construction costs and can reduce housing supply. On the other hand, real estate has historically been viewed by some investors as a hedge against inflation, which can sustain or even lift home prices during inflationary periods.
For buyers, inflation erodes purchasing power, especially when wage growth doesn't keep pace with rising prices. The Consumer Price Index (CPI), published monthly by the Bureau of Labor Statistics, is the primary gauge of broad inflation — but housing analysts also watch the Producer Price Index (PPI) for signals about construction cost pressures that may affect future supply. What housing inventory really tells us explains how supply constraints interact with these cost pressures.
Inflation can lift home prices while simultaneously eroding the purchasing power of prospective buyers.
Consumer Confidence Index
Buying a home is often the largest financial commitment a household makes, and people tend to make that commitment when they feel secure about their financial future. The Consumer Confidence Index, published monthly by The Conference Board, measures how optimistic or pessimistic Americans feel about current and near-term economic conditions.
When confidence is high, buyers are more willing to stretch financially and move quickly. When confidence drops — even before unemployment rises or rates climb — buyers become hesitant, causing demand to soften ahead of what other indicators might show. This makes consumer confidence a useful leading indicator: it often shifts before the housing data follows. Watching multi-month trends in the index, rather than any single reading, gives a clearer picture of direction.
Consumer confidence often shifts buyer behavior before unemployment or price data registers the change.
Housing Starts and Building Permits
Housing starts — the number of new residential construction projects begun in a given period — and building permits are published monthly by the U.S. Census Bureau and the Department of Housing and Urban Development. Together, they signal where supply is headed months or even years down the line.
A sustained rise in building permits suggests that developers expect demand to remain strong and that more inventory is coming. A pullback in permits often signals that builders are anticipating softer demand or are squeezed by higher financing and material costs. These figures are particularly important for understanding long-run affordability trends. New construction versus existing home supply shapes market dynamics in distinct ways, and understanding both helps complete the picture.
Building permit trends can signal future supply shifts months before new homes reach the market.
Gross Domestic Product (GDP) Growth
GDP measures the total value of goods and services produced in the economy and is reported quarterly by the Bureau of Economic Analysis. Strong GDP growth generally supports housing demand by reflecting a healthy, expanding economy with rising incomes and business investment. Contracting GDP — particularly across two consecutive quarters — signals a recession, which historically has led to reduced housing demand, tighter credit conditions, and in some cases, price corrections.
GDP is a lagging indicator, meaning it confirms what has already happened rather than predicting what comes next. Still, watching GDP trends alongside leading signals like consumer confidence and building permits gives a fuller picture of where the housing market may be in its cycle. For more on that broader context, questions to ask before acting on trend headlines offers a useful decision-making framework.
GDP growth confirms economic health, but it works best when read alongside forward-looking housing indicators.
Putting the Signals Together
No single indicator predicts where housing is headed with certainty. Skilled analysts look for patterns across multiple signals — when interest rates are rising, employment is softening, and consumer confidence is falling simultaneously, the cumulative effect on housing demand is likely to be significant. When signals conflict, as they often do, caution is warranted.
Track trends, not single data points
Economic indicators are most useful when observed over multiple months rather than reacting to a single release. A one-month spike or dip in jobs, confidence, or inflation may be noise. Sustained directional movement across two or three reporting periods is a more reliable signal that something structural is shifting in the housing market.
If you want to apply these signals to real market reports, reading a housing market report without getting lost in the numbers walks through the key metrics in plain language. And because national averages frequently obscure local realities, national trends rarely tell the whole local story — so always ground your interpretation in data specific to your area. Consider consulting a licensed real estate professional or financial adviser before making major decisions based on market trends.
This article is for general informational purposes only and does not constitute financial, investment, or real estate advice. Economic indicators are useful context, not guarantees of future market behavior.