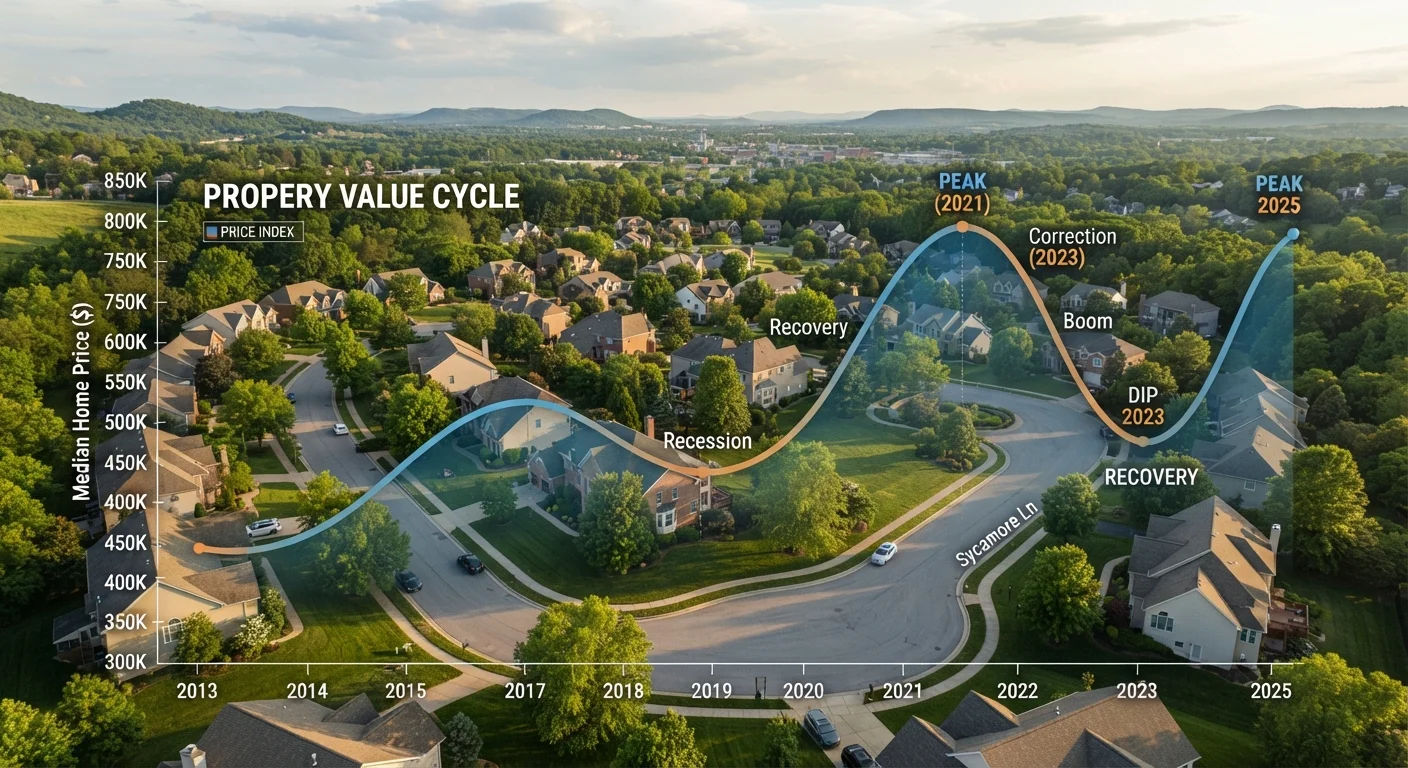
The Four Phases of a Housing Cycle
Housing markets do not move randomly. They follow a recognizable sequence of phases, each with distinct characteristics that show up in the data if you know what to look for. For a plain-language reference to the terms used to track these phases, see the Housing Market Glossary.
- Expansion: Demand grows faster than supply. Home prices rise, inventory tightens, and homes sell quickly — often above asking price. New construction picks up in response.
- Peak: Prices reach their highest point. Affordability becomes strained, demand begins to cool, and the pace of sales starts to slow — though prices may not yet reflect this.
- Contraction: Supply builds as demand weakens. Days on market increase, price reductions become more common, and the market shifts toward buyers.
- Recovery: Prices stabilize and begin to move upward again as excess inventory is absorbed, confidence returns, and demand gradually rebuilds.
Recognizing which phase a market is entering — even approximately — helps buyers and sellers set realistic expectations, though it should never substitute for sound personal financial planning.
18 months
Median seller's market inventory threshold
Industry research consistently identifies roughly 6 months of supply as the balance point between buyer and seller conditions; well-below-average inventory sustained seller-side dynamics across many U.S. metros for an extended period following 2020.
~7–18 yrs
Typical length of a full U.S. housing cycle
Historical analysis of U.S. housing data by researchers at institutions including the Federal Reserve and academic economists places full peak-to-peak cycles in this range, though durations vary significantly by region.
30%+
National median home price increase, 2020–2022
The National Association of Realtors and related data sources documented an unusually rapid run-up in median home prices during the pandemic expansion phase, driven by record-low rates and supply shortages.
What Drives Prices Up, Down, and Sideways
Multiple forces act on home prices simultaneously, which is why the relationship between any single variable and price is rarely straightforward. Economic indicators like interest rates, employment, and inflation all ripple through real estate in ways that interact with each other.
Supply and Demand
The most fundamental driver. When more buyers compete for fewer homes, prices rise. When listings accumulate faster than buyers can absorb them, prices soften. Inventory — measured in months of supply — is one of the clearest real-time signals available.
Mortgage Rates
Higher borrowing costs reduce how much home a buyer can afford at a given income level, which can suppress demand and slow price growth. However, the relationship is not mechanical. Higher rates do not automatically produce lower prices — sellers may hold firm, and limited supply can offset affordability pressure.
Employment and Wages
A strong local job market draws new residents and supports household formation — both fuel housing demand. Conversely, major layoffs or a shift in an area's economic base can dampen demand even in a national expansion.
New Construction
When builders add significant supply during a peak phase, it can accelerate the transition to contraction. Chronic underbuilding — a pattern seen across many U.S. metros — can keep prices elevated even during periods of weaker demand.
Watch Inventory Levels First
Months of housing supply is one of the most responsive leading indicators of a market shift. When inventory crosses above or below key thresholds — roughly three months for a seller's market and six months for a buyer's market — price trends typically follow within one to two quarters. Check your local MLS data or regional housing reports monthly to spot early movements.
Reading the Signals: What to Watch
National headlines rarely tell the whole story. A market described as "cooling" nationally may still be intensely competitive in specific metros or zip codes. Learning to read local data is more valuable than following broad trend coverage.
Key metrics to track include:
- Months of supply: Below 3 months generally indicates a seller's market; above 6 months suggests buyer conditions.
- Days on market: Rising average days on market is an early sign that demand is softening.
- List-to-sale price ratio: When homes consistently sell above list price, the market is competitive; discounts signal a shift.
- Year-over-year price changes: Direction matters more than magnitude in the short term.
For a structured walkthrough of these metrics, reading a housing market report breaks down each data point and what it signals about local conditions.
National Data vs. Your Local Market
National median home price figures are a useful reference, but they can be misleading for individual decisions. A city adding tech jobs may be in a full expansion while a nearby rural county sits in prolonged contraction. Always anchor your analysis in data specific to the metro, city, or neighborhood you are actually evaluating.
How to Use Cycle Awareness in Your Own Decisions
Understanding housing cycles is useful context — but it is not a decision-making system. No analyst can pinpoint exactly when a cycle will shift, and attempting to time the market carries its own risks. For buyers, sellers, and renters alike, cycle awareness works best as a way to calibrate expectations rather than drive timing.
If you are buying a home, a contraction-phase market may offer more negotiating room and less competition — but only if your financial situation supports the purchase regardless of short-term price movement. If you are renting, understanding that rental demand often rises during housing contractions can help you anticipate lease renewal dynamics.
Before acting on any market headline, work through the specifics of your local data. A structured market checkup can help you verify what the data actually says about your situation — and whether a reported trend applies where you live.
For those starting from scratch, the beginner's roadmap to the U.S. housing market covers the foundational forces that shape prices across America.
This article is for general informational and educational purposes only and does not constitute financial, investment, or legal advice. Consult a qualified financial adviser or real estate professional before making decisions based on market conditions.